#ERcamp13 at George Washington University

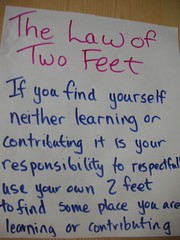
“The law of two feet” by Deb Schultz

This is going to be long and not my usual style of conference notetaking. Because this was an unconference, there really wasn’t much in the way of prepared presentations, except for the lightening talks in the morning. What follows below the jump is what I captured from the conversations, often simply questions posed that were left open for anyone to answer, or at least consider.

Some of the good aspects of the unconference style was the free-form nature of the discussions. We generally stayed on topic, but even when we didn’t, it was about a relevant or important thing that lead to the tangents, so there were still plenty of things to take away. However, this format also requires someone present who is prepared to seed the conversation if it lulls or dies and no one steps in to start a new topic.

Also, if a session is designed to be a conversation around a topic, it will fall flat if it becomes all about one person or the quirks of their own institution. I had to work pretty hard on that one during the session I led, particularly when it seemed that the problem I was hoping to discuss wasn’t an issue for several of the folks present because of how they handle the workflow.

Some of the best conversations I had were during the gathering/breakfast time as well as lunch, lending even more to the unconference ethos of learning from each other as peers.

Anyway, here are my notes.

Continue reading “#ERcamp13 at George Washington University”

ER&L 2013: E-Resources, E-Realities

“Tools” by Josep Ma. Rosell

Speakers: Jennifer Bazeley (Miami University) & Nancy Beals (Wayne State University)

Despite all the research on what we need/want, but no one is building commercial products that meet all our needs and addresses the impediments of cost and dwindling staff.

Beals says that the ERM is not used for workflow, so they needed other tools, with a priority on project management and Excel proficiency. They use an internal listserv, UKSG Transfer, Trello (project management software), and a blog, to keep track of changes in eresources.

Other tools for professional productivity and collaboration: iPads with Remember the Milk or Evernote, Google spreadsheets (project portfolio management organization-wide), and LibGuides.

Bazeley stepped into the role of organizing eresources information in 2009, with no existing tool or hub, which gave her room to experiment. For documentation, they use PBWiki (good for version tracking, particularly to correct errors) with an embedded departmental Google calender. For communication, they use LibGuides for internal documents, and you can embed RSS, Google Docs, Yahoo Pipes aggregating RSS feeds, Google forms for eresource access issues, links to Google spreadsheets with usage data, etc.. For login information, they use KeePass Password Safe. Rather than claiming in the ILS, they’ve moved to using the claim checker tool from the subscription agent.

Tools covered:

  • Google Calendar
  • Google Docs (includes forms & spreadsheets)
  • PBWiki
  • LibGuides
  • Yahoo Pipes
  • WordPress
  • KeePass Password Safe
  • PDF Creator
  • EBSCOnet

Others listed:

  • Blogger (blog software)
  • Mendeley (ref manager)
  • Vimeo (videos)
  • Jing (screenshot/screencast)
  • GIMP (image editor)
  • MediaWiki (Wiki software)
  • LastPass (password manager)
  • OpenOffice (software suite)
  • PDF Creator (PDF manipulation)
  • Slideshare (presentation manager)
  • Filezilla (ftp software)
  • Zoho Creator (database software)
  • Dropbox (cloud storage)
  • Github (software management)
  • Subscription agent software (SwetsWise, EBSCOnet)
  • Microsoft Excel / Access
  • Course Management Software (Moodle, Sakai, Blackboard)
  • Open Source ERMS: ERMes (University of Wisconsin-La Crosse) & CORAL (University of Notre Dame)

libday7: day 5

The day began with a mish-mash of sorting through email, updating my calendar, and other simple tasks like approving the time sheet for the one employee I supervise. I gave myself a little extra time to work through the email I had flagged for today. Fridays always end up with a pile of messages that are pending action from someone else or are things I didn’t consider urgent enough to get to earlier in the week.

physical representation of the virtual

Spent more time on the print journal holdings project. I am estimating another 10.5 hrs of work still needs to go into transferring and checking data, and it’s encouraging to see that the end may be as soon as next week. When I came to a stopping point, I set it aside for a few to take care of some journal renewal instructions that came through today (changing formats).

Pretty soon it was time to meet some folks from Information Services and the VP for lunch. I’d received a call this morning from her administrative assistant to see if I was available to join them. Apparently she does these lunches regularly, but this was my first. I’d planned on getting Boka Truck for lunch, but I can do that another time. Plus, can’t beat air conditioning on a day like today.

After lunch, I caught up on some social media feeds, then started back in on the print journal inventory project. Managed to get through a sheet or two before my calendar alerted me that it was time for 2-for-1 frappuccinos from the coffee shop attached to the library, so I gathered a small posse and went for an afternoon pick-me-up. Armed with caffeine and sugar, I delved back into the spreadsheets.

I was inspired for today’s daily photo, so I took a break from the spreadsheets to get out in the stacks. I think it turned out pretty well. Another break came a bit later with a small rubber band skirmish. The really big ones that ILL use are perfect for the 20″ or so space between my cube and my colleague’s cube.

With about a half hour left of my day, I decided to pause working on the project and clear out any remaining tasks in my inbox list. This included requesting pricing for an online reference book and investigating why the URLs for recently migrated Gale databases were not showing up in the list of URLs associated with our account. Final item on the to-do list was investigating why a faculty member could not download a dissertation but we can. I could not replicate it, and I think it’s user error.

Called it a day and headed on into the weekend. Yee-haw!

NASIG 2011: Reporting on Collections

Speakers: Sandy Hurd, Tina Feick, & John Smith

Development begins with internal discussion, a business case, and a plan for how the data will be harvested. And discussion may need to include the vendors who house or supply the data, like your ILS or ERM.

Product development on the vendor side can be prompted by several things, including specific needs, competition, and items in an RFP. When customers ask for reports, they need to determine if it is a one-time thing, something that can be created by enhancing what they already have, or something they aren’t doing yet. There may be standards, but collaborative data is still custom development between two entities, every time.

Have you peeked under the rug? The report is only as good as the data you have. How much cleanup are you willing to do? How can your vendor help? Before creating reports, think about what you have to solve and what you wish you could solve, statistics you need, the time available to generate them, and whether or not you can do it yourself.

There are traditional reporting tools like spreadsheets, and increasingly there are specialized data storage and analysis tools. We are looking at trends, transactional data, and projections, and we need this information on demand and more frequently than in the past. And the data needs to be interoperable. (Dani Roach is quietly shouting, “CORE! CORE!”) Ideally, we would be able to load relevant data from our ERMS, acquisitions modules, and other systems.

One use of the data can be to see who is using what, so properly coded patron records are important. The data can also be essential for justifying the redistribution of resources. People may not like what they hear, but at least you have the data to back it up.

The spreadsheets are not the reports. They are the data.

dreaming about the future of data in libraries

I spent most of the past two months downloading, massaging, and uploading to our ERMS a wide variety of COUNTER and non-COUNTER statistics. At times it is mind-numbing work, but taken in small doses, it’s interesting stuff.

The reference librarians make most of the purchasing decisions and deliver instruction to students and faculty on the library’s resources, but in the end, it’s the research needs of the students and faculty that dictate what they use. Then, every year, I get to look at what little information we have about their research choices.

Sometimes I’ll look at a journal title and wonder who in the world would want to read anything from that, but as it turns out, quite a number of someones (or maybe just one highly literate researcher) have read it in the past year.

Depending on the journal focus, it may be easy to identify where we need to beef up our resources based on high use, but for the more general things, I wish we had more detail about the use. Maybe not article-level, but perhaps a tag cloud — or something in that vein — pulled together from keywords or index headings. There’s so much more data floating around out there that could assist in collection development that we don’t have access to.

And then I think about the time it takes me to gather the data we have, not to mention the time it takes to analyze it, and I’m secretly relieved that’s all there is.

But, maybe someday when our ERMS have CRM-like data analysis tools and I’m not doing it all manually using Excel spreadsheets… Maybe then I’ll be ready to delve deeper into what exactly our students and faculty are using to meet their research needs.

ER&L: Making Data Work

Speaker: Jamene Brooks-Kieffer

Spreadsheets are not usable information to most everyone else. It is not a communication tool. A textual summary or data story or info graphic conveys the information found in spreadsheets in ways they are easier to understand.

Every audience has diverse needs. Consider the scope appropriate for the story you need to tell.

Data stories are created with the tools you already have. You don’t need special funding or resources — use what you already have.

Example: In order to understand how the link resolver data is different from publisher data, she started a blog to explain it to internal users.

Speaker: John McDonald

Graphics can simplify the telling of complex stories. But make sure your graphic tells the right story.

Know your audience. Showing the drop in library funding compared to market trend to faculty will get them up in arms, but administrators see it as a correction to an out of control market and maybe we don’t need all those resources.

Collaborate with other people to improve your presentation. You might understand the data, but you are not your audience.

Speaker: Michael Levine-Clark

Guess what? You need to know your audience! And spreadsheets don’t tell the story to everyone.

Take the example of moving collections to storage. Faculty need reassurance that the things they browse will remain in the library. Some disciplines want more specifics about what is going and what is staying. Architects need space planning data and they don’t care about the reasons. Administrators need justification for retaining the materials, regardless of where they end up, and the cost of retrieving materials from storage. Board of Trustees need information about the value of paper collections and being a little vague about the specifics (talking about low use rather than no use).

LibFest: Telling your Story with Usage Statistics — Making data work

presenter: Jamene Brooks-Kieffer

She won’t be talking about complex tools or telling you to hire more staff. Rather, she’ll be looking at ways we can use what we have to do it better.

Right now, we have too much data from too many sources, and we don’t have enough time or staff to deal with it. And, nobody cares about it anyway. Instead of feeling blue about this, change your attitude.

Start by looking at smaller chunks. Look at all of the data types and sources, then choose one to focus on. Don’t stress about the rest. How to pick which one? Select data that has been consistently collected over time. If it’s focused on a specific activity, it’ll be easier to create a story about it. And finally, the data should be both interesting and accessible to you.

By selecting only one source of data, you have reduced the stress on time. You also need to acknowledge your limits in order to move forward. You can’t work miracles, but you can show enough impact to get others on board. Tie the data to your organizational goals. Analyze the data using the tools you already have (i.e. Excel), and then publicize the results of your work.

Why use Excel? It’s pretty universal, and there are free alternatives for spreadsheets if you need them. Three useful Excel tools: import & manipulate files of various formats (CSV files), consolidate similar information (total annual data from monthly worksheets), and conditional formatting (identify cost/use over thresholds).

The spreadsheets are for you, not the stakeholders. Stop relying on them to communicate your data. The trouble with spreadsheets is that although they contain a lot of data, it’s challenging for those unfamiliar with the sources to understand the meaning of the data. Sending a summary/story will get your message across faster and more clearly.

Data has context, settings, complexities, and conflicts. One of the best ways of communicating it is through a story. Give stakeholders the context to hang the numbers on and a way to remember why they are important. Write what you know, focus on the important things, and keep it brief and meaningful. Here is an example: Data Stories: A dirty job.

Data stories are everywhere. It’s not strictly for usage or financial data. If you have a specific question you want answered through data, it makes it easier to compose the story.

Convince yourself to act; your actions will persuade others.

presenter: Katy Silberger

She will be showing three scenarios for observing user behavior through statistics: looking at the past with vendor supplied statistics, assessing current user behavior with Google Analytics, and anticipating user behavior with Google Analytics.

They started looking at usage patterns before and after implementing federated searching. It was hard to answer the question of how federated searching changed user behavior. They used vendor usage reports and website visits to calculate the number of articles retrieved per website visit and articles retrieved per search. They found that the federated search tool generated an increase in article/use. The ratios take into account the fluctuation in user populations.

Google Analytics could be used to identify use from students abroad. It’s also helpful for identifying trends in mobile web access.
nasig day 3 & 4

I ended up having only one more chance to get online while at the conference, and that was during the closing session at Centennial Hall. It didn’t seem to be appropriate to blog while listening to the final vision session, so I decided to wait until I returned home.

I ended up having only one more chance to get online while at the conference, and that was during the closing session at Centennial Hall. It didn’t seem to be appropriate to blog while listening to the final vision session, so I decided to wait until I returned home.

Continue reading “nasig day 3 & 4”

css.php