ER&L 2012: Electronic Resources Workflow Analysis & Process Improvement

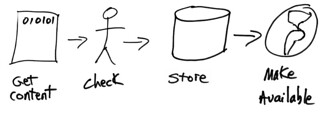
workflow at the most basic level
illustration by wlef70

Speakers: Ros Raeford & Beverly Dowdy

Users were unhappy with eresource management, due in part to their ad hoc approach, and they relied on users to notify them when there were access issues. A heavy reliance on email and memory means things slip through the cracks. They were not a train wreck waiting to happen, they were train wreck that had already occurred.

Needed to develop a deeper understanding of their workflows and processes to identify areas for improvement. The reason that earlier attempts have failed was due to not having all the right people at the table. Each stage of the lifecycle needs to be there.

Oliver Pesch’s 2009 presentation on “ERMS and the E-Resources Lifecycle” provided the framework they used. They created a staff responsibility matrix to determine exactly what they did, and then did interviews to get at how they did it. The narrative was translated to a workflow diagram for each kind of resource (ebooks, ejournals, etc.).

Even though some of the subject librarians were good about checking for dups before requesting things, acquisitions still had to repeat the process because they don’t know if it was done. This is just one example of a duplication of effort that they discovered in their workflow review.

For the ebook package process, they found it was so unclear they couldn’t even diagram it. It’s very linear, and it could have a number of processes happening in parallel.

Lots of words on screen with great ideas of things to do for quality control and user interface improvements. Presenter does not highlight any. Will have to look at it later.

One thing they mentioned is identifying essential tasks that are done by only one staff. They then did cross-training to make sure that if the one is out for the day, someone else can do it.

Surprisingly, they were not using EDI for firm orders, nor had they implemented tools like PromptCat.

Applications that make things work for them:

JTacq — using this for the acquisition/collections workflow. I’ve never heard of it, but will investigate.

ImageNow — not an ERM — a document management tool. Enterprise content management, and being used by many university departments but not many libraries.

They used SharePoint at a meeting space for the teams.

IL 2010: Dashboards, Data, and Decisions

[I took notes on paper because my netbook power cord was in my checked bag that SFO briefly lost on the way here. This is an edited transfer to electronic.]

presenter: Joseph Baisano

Dashboards pull information together and make it visible in one place. They need to be simple, built on existing data, but expandable.

Baisano is at SUNY Stonybrook, and they opted to go with Microsoft SharePoint 2010 to create their dashboards. The content can be made visible and editable through user permissions. Right now, their data connections include their catalog, proxy server, JCR, ERMS, and web statistics, and they are looking into using the API to pull license information from their ERMS.

In the future, they hope to use APIs from sources that provide them (Google Analytics, their ERMS, etc.) to create mashups and more on-the-fly graphs. They’re also looking at an open source alternative to SharePoint called Pentaho, which already has many of the plugins they want and comes in free and paid support flavors.

presenter: Cindi Trainor

[Trainor had significant technical difficulties with her Mac and the projector, which resulted in only 10 minutes of a slightly muddled presentation, but she had some great ideas for visualizations to share, so here’s as much as I captured of them.]

Graphs often tell us what we already know, so look at it from a different angle to learn something new. Gapminder plots data in three dimensions – comparing two components of each set over time using bubble graphs. Excel can do bubble graphs as well, but with some limitations.

In her example, Trainor showed reference transactions along the x-axis, the gate count along the y-axis, and the size of the circle represented the number of circulation transactions. Each bubble represented a campus library and each graph was for the year’s totals. By doing this, she was able to suss out some interesting trends and quirks to investigate that were hidden in the traditional line graphs.

NASIG 2010: Integrating Usage Statistics into Collection Development Decisions

Presenters: Dani Roach, University of St. Thomas and Linda Hulbert, University of St. Thomas

As with most libraries, they are faced with needing to downsize their purchases in order to fit within reduced budgets, so good tools must be employed to determine which stuff to remove or acquire.

The statistics for impact factor means little to librarians, since the “best” journals may not be appropriate for the programs the library supports. Quantitative data like cost per use, historical trends, and ILL data are more useful for libraries. Combine these with reviews, availability, features, user feedback, and the dust layer on the materials, and then you have some useful information for making decisions.

Usage statistics are just one component that we can use to analyze the value of resources. There are other variables than cost and other methods than cost per use, but these are what we most often apply.

Other variables can include funds/subjects, format, and identifiers like ISSN. Cost needs to be defined locally, as libraries manage them differently for annual subscriptions, multiple payments/funds, one-time archive fees, hosting fees, and single title databases or ebooks. Use is also tricky. A PDF download in a JR1 report is different from a session count in a DB1 report is different from a reshelve count for a bound journal. Local consistency with documentation is best practice for sorting this out.

Library-wide SharePoint service allows them to drop documents with subscription and analysis information into one location for liaisons to use. [We have a shared network folder that I do some of this with — I wonder if SharePoint would be better at managing all of the files?]

For print statistics, they track separately bound volume use versus new issue use, scanning barcodes into their ILS to keep a count. [I’m impressed that they have enough print journal use to do that rather than hash marks on a sheet of paper. We had 350 reshelved in last year, including ILL use, if I remember correctly.]

Once they have the data, they use what they call a “fairness factor” formula to normalize the various subject areas to determine if materials budgets are fairly allocated across all disciplines and programs. Applying this sort of thing now would likely shock budgets, so they decided to apply new money using the fairness factor, and gradually underfunded areas are being brought into balance without penalizing overfunded areas.

They have stopped trying to achieve a balance between books and periodicals. They’ve left that up to the liaisons to determine what is best for their disciplines and programs.

They don’t hide their cancellation list, and if any of the user community wants to keep something, they’ve been willing to retain it. However, they get few requests to retain content, and they think it is in part because the user community can see the cost, use, and other factors that indicate the value of the resource for the local community.

They have determined that it costs them around $52 a title to manage a print subscription, and over $200 a title to manage an online subscription, mainly because of the level of expertise involved. So, there really are no “free” subscriptions, and if you want to get into the cost of binding/reshelving, you need to factor in the managerial costs of electronic titles, as well.

Future trends and issues: more granularity, more integration of print and online usage, interoperability and migration options for data and systems, continued standards development, and continued development of tools and systems.

Anything worth doing is worth overdoing. You can gather Ulrich’s reports, Eigen factors, relative price indexes, and so much more, but at some point, you have to decide if the return is worth the investment of time and resources.

css.php