ER&L 2016: Trying Something New: Examining Usage on the Macro and Micro Levels in the Sciences

Cheaper by the yard
“Cheaper by the yard” by Bill Smith

Speakers: Krystie (Klahn) Wilfon, Columbia University; Laura Schimming and Elsa Anderson, Icahn School of Medicine at Mount Sinai

Columbia has reduced their print collection in part due to size, but more because their users prefer electronic collections. Wilfon has employed a systematic collection of cost and data over time, a series of analysis templates based on item type and data source, and an organized system of distributing the end product. [She uses similar kinds of metrics I use in my reports, but far more data-driven and detailed. She’s only done this for two years, so I’m not sure how sustainable this is. I know how much time my own reports take each month, and I don’t think I would have the capacity to add more data to them.]

Mount Sinai had a lot of changes in 2013 that changed their collection development practices. They wanted to assess the resources they have, but found that traditional metrics were problematic. Citation counts don’t factor in the resources used but not cited; journal impact factors have their own issues; etc. They wanted to include altmetrics in the assessment, as well. They ended up using Altmetrics Explorer.

Rather than looking at CPU for the journal package as a whole, she broke it up by journal title and also looked at the number of articles published per title as a percentage of the whole. This is only one picture, though. Using Altmetric Explorer, they found that the newsletter in the package, while expensive in the cost per use, had a much higher median Altmetric score than the main peer reviewed journal in the package (score divided by the number of articles published in that year). So, for a traditional journal, citations and impact factor and COUNTER usage are important, but maybe for a newsletter type publication, altmetrics are more important. Also, within a single package of journal titles, there are going to be different types of journals. You need to figure out how to evaluate them without using the same stick.

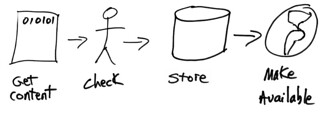
NASIG 2012: A Model for Electronic Resources Assessment

Presenter: Sarah Sutton, Texas A&M University-Corpus Christi

Began the model with the trigger event — a resource comes up for renewal. Then she began looking at what information is needed to make the decision.

For A&I databases, the primary data pieces are the searches and sessions from the COUNTER release 3 reports. For full-text resources, the primary data pieces are the full-text downloads also from the COUNTER reports. In addition to COUNTER and other publisher supplied usage data, she looks at local data points. Link-outs from the a-to-z list of databases tells her what resources her users are consciously choosing to use, and not necessarily something they arrive at via a discovery service or Google. She’s able to pull this from the content management system they use.

Once the data has been collected, it can be compared to the baseline. She created a spreadsheet listing all of the resources, with a column each for searches, sessions, downloads, and link-outs. The baseline set of core resources was based on a combination of high link-outs and high usage. These were grouped by similar numbers/type of resource. Next, she calculated the cost/use for each of the four use types, as well as the percentage of change in use over time.

After the baseline is established, she compares the renewing resource to that baseline. This isn’t always a yes or no answer, but more of a yes or maybe answer. Often more analysis is needed if it is tending towards no. More data may include overlap analysis (unique to your library collection), citation lists (unique titles — compare them with a list of highly-cited journals at your institution or faculty requests or appear on a core title list), journal-level usage of the unique titles, and impact factors of the unique titles.

Audience question: What about qualitative data? Talk to your users. Does not have a suggestion for how to incorporate that into the model without increasing the length of time in the review process.

Audience question: How much staff time does this take? Most of the work is in setting up the baseline. The rest depends on how much additional investigation is needed.

[I had several conversations with folks after this session who expressed concern with the method used for determining the baseline. Namely, that it excludes A&I resources and assumes that usage data is accurate. I would caution anyone from wholesale adopting this as the only method of determining renewals. Without conversation and relationships with faculty/departments, we may not truly understand what the numbers are telling us.]

ER&L 2012: Electronic Resources Workflow Analysis & Process Improvement

workflow at the most basic level
illustration by wlef70

Speakers: Ros Raeford & Beverly Dowdy

Users were unhappy with eresource management, due in part to their ad hoc approach, and they relied on users to notify them when there were access issues. A heavy reliance on email and memory means things slip through the cracks. They were not a train wreck waiting to happen, they were train wreck that had already occurred.

Needed to develop a deeper understanding of their workflows and processes to identify areas for improvement. The reason that earlier attempts have failed was due to not having all the right people at the table. Each stage of the lifecycle needs to be there.

Oliver Pesch’s 2009 presentation on “ERMS and the E-Resources Lifecycle” provided the framework they used. They created a staff responsibility matrix to determine exactly what they did, and then did interviews to get at how they did it. The narrative was translated to a workflow diagram for each kind of resource (ebooks, ejournals, etc.).

Even though some of the subject librarians were good about checking for dups before requesting things, acquisitions still had to repeat the process because they don’t know if it was done. This is just one example of a duplication of effort that they discovered in their workflow review.

For the ebook package process, they found it was so unclear they couldn’t even diagram it. It’s very linear, and it could have a number of processes happening in parallel.

Lots of words on screen with great ideas of things to do for quality control and user interface improvements. Presenter does not highlight any. Will have to look at it later.

One thing they mentioned is identifying essential tasks that are done by only one staff. They then did cross-training to make sure that if the one is out for the day, someone else can do it.

Surprisingly, they were not using EDI for firm orders, nor had they implemented tools like PromptCat.

Applications that make things work for them:

JTacq — using this for the acquisition/collections workflow. I’ve never heard of it, but will investigate.

ImageNow — not an ERM — a document management tool. Enterprise content management, and being used by many university departments but not many libraries.

They used SharePoint at a meeting space for the teams.

peer-to-peer sharing — the legal kind

I’ve been watching with interest to see what comes out of the TERMS: Techniques for Electronic Resources Management, for obvious reasons. Jill Emery and Graham Stone envision this to be a concise listing of the six major stages of electronic resources management, as well as a place to share tips and workflows relating to each. As they publish each section, I’ve marveled at how concise and clear they are. If you do anything with electronic resources management, you need to be following this thing.

Evaluation of resources has been a subject near and dear to my heart for many years, and increasingly so as we’ve needed to justify why we continue to pay for one resource when we would like to purchase another equally desired resource. And in relation to that, visualization of data and telling data stories are also professional interests of mine.

renewal decision report
renewal decision report example

When the section on annual review was published last month, it included an appendix that is an example of usage and cost  data for a resource delivered as both flat numbers and a graph. While this is still a rather technical presentation, it included several elements I had not considered before: cost as a percentage of the budget line, cost per student, use per student, and a mean use for each year. I decided this method of delivering statistical information about our electronic resources might be more useful to our subject specialists than my straight-up number approach. So, I’ve now incorporated it into the annual review checklist that I send out to the subject specialists in advance of renewal deadlines.

I’m not going to lie — this isn’t a fast report to create from scratch. However, it has made a few folks take a hard look at some resources and the patterns of their use, and as far as I’m concerned, that makes it work my time and effort. Repeat use will be much faster, since I’ll just need to add one year’s worth of data.

NASIG 2011: Using Assessment to Make Collection Development Decisions

Speaker: Mary Ann Trail & Kerry Chang FitzGibbon

It is not in the interest of faculty to cut journal titles because it may be perceived as an admission that it is not needed. With relying on faculty input for collection decisions, the collection can become skewed when certain faculty are more vocal than others.

When a new director arrived in 2000, they began to use more data to make decisions. And, the increase in aggregator databases and ejournals changed what was being collected. In addition to electronic publishing, electronic communication has changed the platform and audience for faculty communicating with each other and administrators, which can be both good and bad for library budgets.

In 2005, after some revision of collection methods, cancellations, and reallocation, they went to a periodicals allocation formula. This didn’t work out as well as expected, and was abandoned in 2008.

As a part of their assessment projects in 2008, they looked at the overlap between print and electronic titles to see if they could justify canceling the print in order to address the budget deficit. Most importantly, they wanted to proactively calm the faculty, who were already upset about past cancellations, with assurances that they would not lose access to the titles.

They used their ERMS to generate overlap analysis report, and after some unnecessary and complicated exporting and sorting, she was able to identify overlaps with their print collection. Then she identified the current subscriptions before going to the databases to verify that the access is correct and noted any embargo information. This was then combined with budget line, costs, and three years of usage (both print and electronic for non-aggregator access).

They met their budget target by canceling the print journals, and they used the term “format change” instead of cancel when they communicated with faculty. Faculty showed more support for this approach, and were more willing to advocate for library funds.

Did they consider publications that have color illustrations or other materials that are better in print? Yes, and most of them were retained in print.

Did they look at acquiring other databases to replace additional print cancellations? No, not with their funding situation.

What was the contingency plan for titles removed from the aggregator? Would resubscribe if the faculty asked for it, but funds would likely come from the monograph budget.

ER&L: Buzz Session – Usage Data and Assessment

What are the kinds of problems with collecting COUNTER and other reports? What do you do with them when you have them?

What is a good cost per use? Compare it to the alternative like ILL. For databases, trends are important.

Non-COUNTER stats can be useful to see trends, so don’t discount them.

Do you incorporate data about the university in makings decisions? Rankings in value from faculty or students (using star rating in LibGuides or something else)?

When usage is low and cost is high, that may be the best thing to cancel in budget cuts, even if everyone thinks it’s important to have the resource just in case.

How about using stats for low use titles to get out of a big deal package? Comparing the cost per use of core titles versus the rest, then use that to reconfigure the package as needed.

How about calculating the cost per use from month to month?

ER&L 2010: Beyond Log-ons and Downloads – meaningful measures of e-resource use

Speaker: Rachel A. Flemming-May

What is “use”? Is it an event? Something that can be measured (with numbers)? Why does it matter?

We spend a lot of money on these resources, and use is frequently treated as an objective for evaluating the value of the resource. But, we don’t really understand what use is.

A primitive concept is something that can’t be boiled down to anything smaller – we just know what it is. Use is frequently treated like a primitive concept – we know it when we see it. To measure use we focus on inputs and outputs, but what do those really say about the nature/value of the library?

This gets more complicated with electronic resources that can be accessed remotely. Patrons often don’t understand that they are using library resources when they use them. “I don’t use the library anymore, I get most of what I need from JSTOR.” D’oh.

Funds are based on assessments and outcomes – how do we show that? The money we spend on electronic resources is not going to get any smaller. ROI is focused more on funded research, but not electronic resources as a whole.

Use is not a primitive concept. When we talk about use, it can be an abstract concept that covers all use of library resources (physical and virtual). Our research often doesn’t specify what we are measuring as use.

Use as a process is the total experience of using the library, from asking reference questions to finding a quiet place to work to accessing resources from home. It is the application of library resources/materials to complete a complex/multi-stage process. We can do observational studies of the physical space, but it’s hard to do them for virtual resources.

Most of our research tends to focus on use as a transaction – things that can be recorded and quantified, but are removed from the user. When we look only at the transaction data, we don’t know anything about why the user viewed/downloaded/searched the resource. Because they are easy to quantify, we over-rely on vendor-supplied usage statistics. We think that COUNTER assures some consistency in measures, but there are still many grey areas (i.e. database time-outs equal more sessions).

We need to shift from focusing on isolated instances of downloads and ref desk questions, but focus on the aggregate of the process from the user perspective. Stats are only one component of this. This is where public services and technical services need to work together to gain a better understanding of the whole. This will require administrative support.

John Law’s study of undergraduate use of resources is a good example of how we need to approach this. Flemming-May thinks that the findings from that study have generated more progress than previous studies that were focused on more specific aspects of use.

How do we do all of this without invading on the privacy of the user? Make sure that your studies are thought-out and pass approval from your institution’s review board.

Transactional data needs to be combined with other information to make it valuable. We can see that a resource is being used or not used, but we need to look deeper to see why and what that means.

As a profession, are we prepared to do the kind of analysis we need to do? Some places are using anthropologists for this. A few LIS programs are requiring a research methods course, but it’s only one class and many don’t get it. This is a great continuing education opportunity for LIS programs.

ER&L 2010: We’ve Got Data – Now What Do We Do With It? Applying Standards to Assess Information Resources

Speakers: Mary Feeney, Ping Situ, and Jim Martin

They had a budget cut (surprise surprise), so they had to asses what to cut using the data they had. Complicating this was a change in organizational structure. In addition, they adopted the BYU project management model. Also, they had to sort out a common approach to assessment across all of the disciplines/resources.

They used their ILLs to gather stats about print resource use. They hired Scholarly Stats to gather their online resource stats, and for publishers/vendors not in Scholarly Stats, they gathered data directly from the vendors/publishers. Their process involved creating spreadsheets of resources by type, and then divided up the work of filling in the info. Potential cancellations were then provided to interested parties for feedback.

Quality standards:

  • 60% of monographs need to show at least one use in the last four years – this was used to apply cuts to the firm orders book budget, which impacts the flexibility for making one-time purchases with remaining funds and the book money was shifted to serial/subscription lines
  • 95% of individual journal titles need to show use in the last three years (both in-house and full-text downloads) – LJUR data was used to add to the data collected about print titles
  • dual format subscriptions required a hybrid approach, and they compared the costs with the online-only model – one might think that switching to online only would be a no-brainer, but licensing issues complicate the matter
  • cost per use of ejournal packages will not exceed twice the cost of ILL articles

One problem with their approach was with the existing procedures that resulted in not capturing data about all print journals. They also need to include local document delivery requests in future analysis. They need to better integrate the assessment of the use of materials in aggregator databases, particularly since users are inherently lazy and will go the easiest route to the content.

Aggregator databases are difficult to compare, and often the ISSN lists are incomplete. And, it’s difficult to compare based on title by title holdings coverage. It’s useful for long-term use comparison, but not this immediate project. Other problems with aggregator databases include duplication, embargos, and completeness of coverage of a title. They used SerSol’s overlap analysis tool to get an idea of duplication. It’s a time-consuming project, so they don’t plan to continue with it for all of their resources.

What if you don’t have any data or the data you have doesn’t have a quality standard? They relied on subject specialists and other members of the campus to assess the value of those resources.

css.php